

Some things run like clockwork.
Every year, near every university, the same cycle: Students leave in summer. The building empties. Then, as the new academic year approaches, they come flooding back. Demand surges. The building fills.
You can set your calendar by it. We see it in client data every year, both in the northern hemisphere and the southern one. Build to Rent demand has a seasonal pattern.
Here is the strange part. The pattern is reliable. The timing is obvious. And most operators still price against it.
Occupancy does not lead demand. Occupancy follows.
Let’s start with the mechanism…
Demand peaks at the end of summer, when students return. Demand falls away through the winter, when almost nobody moves.
Occupancy does something different. Occupancy lags. It keeps climbing after demand has peaked, because you are still filling flats from a full pipeline. It keeps falling after demand has bottomed, because departures outpace arrivals. Occupancy peaks two to three months after demand peaks. And it troughs two to three months after demand troughs.
Picture the two lines together. Demand leads. Occupancy follows. One chases the other around the calendar, always a season behind.
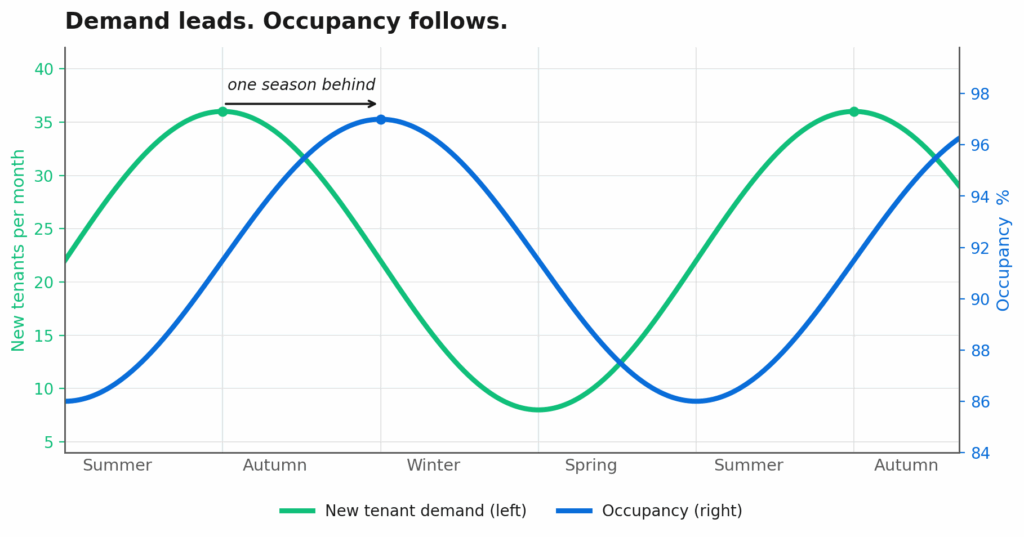
Demand is your leading signal, occupancy is your lagging one. Hold that thought as you read the rest of the article.
So, the right move is simple
If demand leads, surely you should price off demand?
This is often referred to as dynamic pricing. Move your prices with demand, and move them before the demand arrives, not after.
The smart money raises rents ahead of the demand peak, while the pipeline is building. Then they ease off in anticipation of the demand trough. Price for the season that is arriving, not the one that just left.
Simple. Which makes what happens next hard to explain.
Here is what most operators do instead
They look backward.
Autumn arrives. The operator checks the numbers. Demand has been strong. Occupancy has climbed. The building looks full and healthy. What do they do? They raise rents. To borrow a famous line: “It’s the occupancy, stupid”. Stupid indeed!
They raise rents at the exact moment occupancy is about to peak and turn.
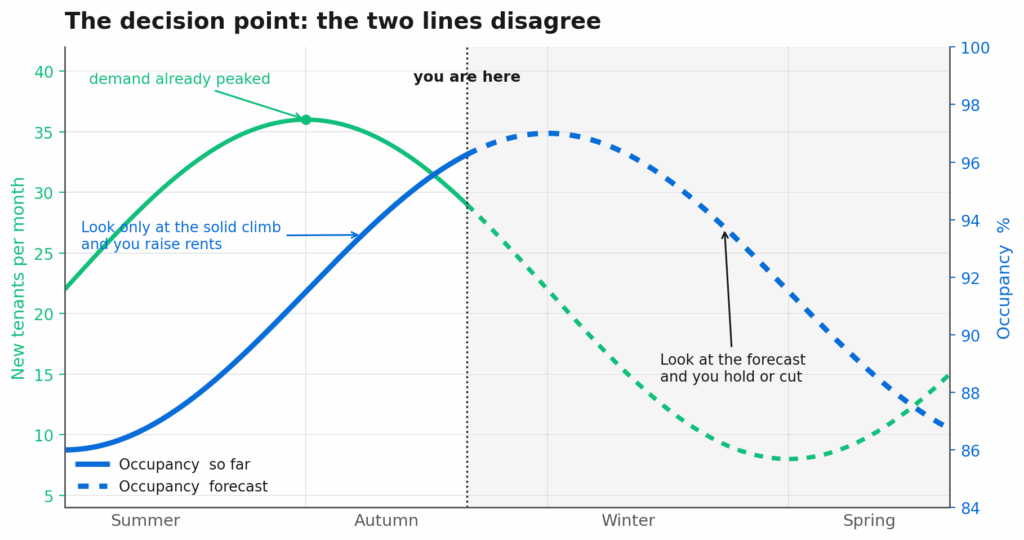
Let’s look at the next chart. The solid line is occupancy. It bottomed a few months ago and it is now climbing hard. If that is all you look at, you raise rents. It would be rude not to.
But look at the demand line. New tenant numbers already peaked. Demand has turned down. And the dotted line is the occupancy forecast. It says the climb is nearly over. Occupancy is about to roll over and slide away toward the summer, when the building empties again.
The historical occupancy line tells you to raise rents. The forecast tells you to hold or cut. They point in opposite directions. Most operators only look at the solid line. They are looking at yesterday.

They make the cycle worse
This is the part that should sting.
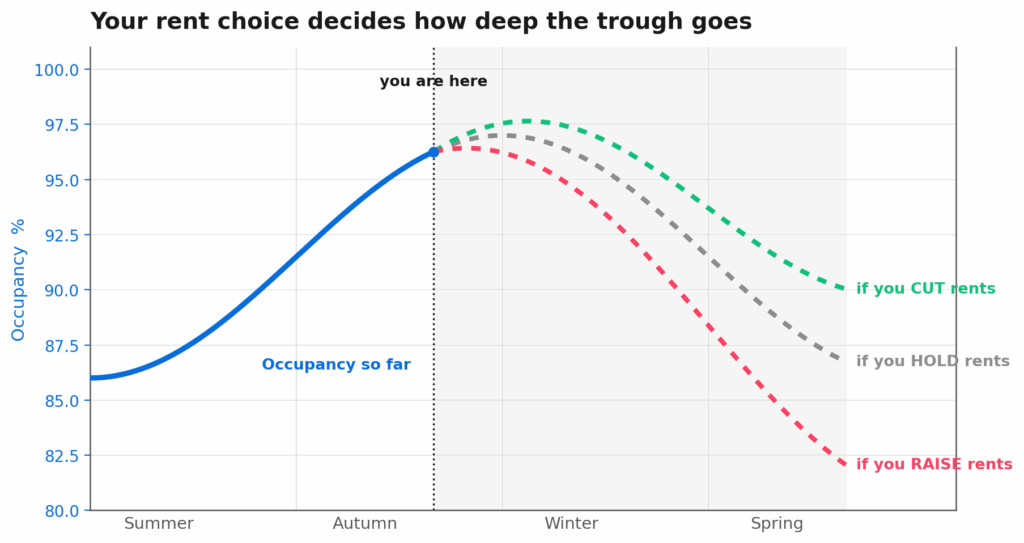
Operators do not simply mistime the cycle. They deepen it. Raising rents into a falling season pushes more tenants out, right when fewer new ones are arriving. The trough gets deeper. The void gets longer. The problem they complain about every year is partly a problem they build themselves.
The next chart makes the choice concrete. One forecast. Three rent decisions. Raise rents and the trough is deepest. Hold them and it is shallower. Cut them and you defend occupancy through the low season.
Then the new season comes, demand recovers, occupancy recovers, and they take the credit.
An empty flat is like an empty seat on a departed flight
Here’s why the timing matters so much.
An empty flat in the trough is revenue you never get back. The month is gone. You cannot sell it later. It is like an empty seat on a plane that has already taken off.
Airlines solved this problem decades ago. They built a whole discipline around it. They call it revenue management. The idea is simple. Price the perishable thing for the demand that is coming, not the demand that just passed. Hotels do it too. And with the help of Price Wizard, Build to Rent is catching up.
A few extra pounds of rent in the peak doesn’t come close to covering a flat that sits vacant for a month. The maths isn’t even close. And yet, the backward looking operator ends up with a surplus of vacant flats, every single year.
The model flips below the equator
One more point, because our clients sit on both sides of the world.
In the southern hemisphere the season inverts. Summer starts 6 months later. And so does the university year. It doesn’t matter whether you’re in Melbourne or Manchester, the pattern is the same.
So, are you pricing for yesterday or tomorrow?
The forward view is not hard to build. If you produce a lease expiry chart every month, you are already on the right track. And in the article The Sprinting Rent Setter, I showed that you are flying blind without one. The next step is to incorporate leading demand signals.
The fix looks easy. Look forward, not back. Price for tomorrow, not yesterday.
If it is that easy, here is the question I cannot shake. I have shown operators this exact picture, in their own data. They agree with every word. Then they do the same thing again the next year.
Why?
That is where I am headed next time.
Greg Einfeld is the Founder and CEO of Price Wizard, helping Build to Rent operators optimise their pricing through data driven approaches.