This article is the third in our series of Rent setter personas. The previous article can
be found here The Overshooting Rent Setter and The Lazy Rent Setter.
As with all case studies in this series, we have started with a real scenario and then
modified the data to maintain data privacy. Nonetheless, the key messages depicted
by the data remain 100% valid.
Today’s article explores the Cautious Rent setter.
Caution is good, isn’t it?
It doesn’t matter what the activity is, I see caution everywhere.
Let’s start with skiing. When I go skiing, I am without doubt the most cautious skier
on the slope. My primary objective is to return home at the end of each day without
any injuries. To achieve this, I have always skied very much within myself. I was
always in control. I never fell. And I rarely exceeded 30km/h.
Until last year.
Last year, I pushed myself a bit, to 40km/h. Still slow compared to all those
daredevils whizzing past me. But fast for me. Sure, I hit the deck a couple of times
each day. But at that speed, it is highly unlikely I would suffer a serious injury. And
you know what? I had lots more fun.
Let’s move onto investing. I see how a lot of other people invest. Young people, old
people, rich people, poor people. The vast majority are too cautious. They prefer to
leave their money in the bank earning 3% p.a. than to invest in shares which have
historically earned 9% p.a. Sure, there will be years when the share market falls.
But there has never been a decade where the share market has underperformed the
bank. To put it another way, if your timeframe is long enough, you are almost
guaranteed to deliver an inferior outcome by putting your money in the bank. And
yet, people continue to use the bank as a long-term investment vehicle.
Caution in setting BTR Rents
While caution has its place, it is probably holding your rents back more than you
realise.
Cautious rent setters tend to err on the side of setting rents too low. They take
comfort in high occupancy rates, just as I took comfort in not falling on the ski slopes,
and just as many investors take comfort from guaranteed low interest rates.
My first encounter with a cautious BTR Rent Setter was at an industry conference.
The speaker was describing his experience leasing up a new building. He was
congratulating himself on reaching stabilisation within a 6 month period, which was
unprecedented at the time. And then he continued gloating about the building’s
100% occupancy rate and 2-month waiting list.
Many in the room were impressed. But I only saw caution and a missed opportunity.
My next encounter with a cautious rent setter was with a client. I estimated that the client
had been setting rents around 4% below optimal on average. [As an aside, how do I
know the rents were 4% too low? The right data and mathematics can help you
estimate how far above or below market you are currently pricing]. Unsurprisingly,
this client also had 100% occupancy and a waiting list.
“the right data and mathematics can help you estimate
how far above or below optimal you are currently pricing”
And then, 3 interesting things happened:
- The client increased rents by 4% for new tenants across the board. I consider
this to be quite a large increase. I usually prefer to increase rents gradually
over time. However this operator was pricing so low, the risk was worth
taking. - Some intermittent vacancies started appearing. Sometimes occupancy would
be at 100%, sometimes it would be more like 99%. These vacancies were
extremely useful and important, because they helped us understand tenant
behaviour. For example:a. Which types of apartments were vacant most often?
b. How long were they vacant for?
c. Which types of apartments got snapped up the fastest when they became
vacant?
d. How far could we increase rents for existing tenants?The client started to build a treasure trove of data which became useful for
future analysis. When you have 100% occupancy, 100% of the time, you
aren’t able to generate and collect the data you need. - The client was able to further increase rents for the apartments that were
most in demand, in this case furnished 1 bedroom apartments.
“When you have 100% occupancy, 100% of the time,
you aren’t able to generate and collect the data you need.”
Chart 1 shows this diagrammatically. Initially, the weekly rent being charged was R0.
At this level of rent, Demand (D0) exceeded supply. The excess of Demand over
Supply (also known as un-met demand) represents the size of the waiting list. Then, the weekly rent was increased from R0 to R1. As a result, Demand reduced to D1 which exactly matched supply.
Chart 1: Demand and Supply Curve
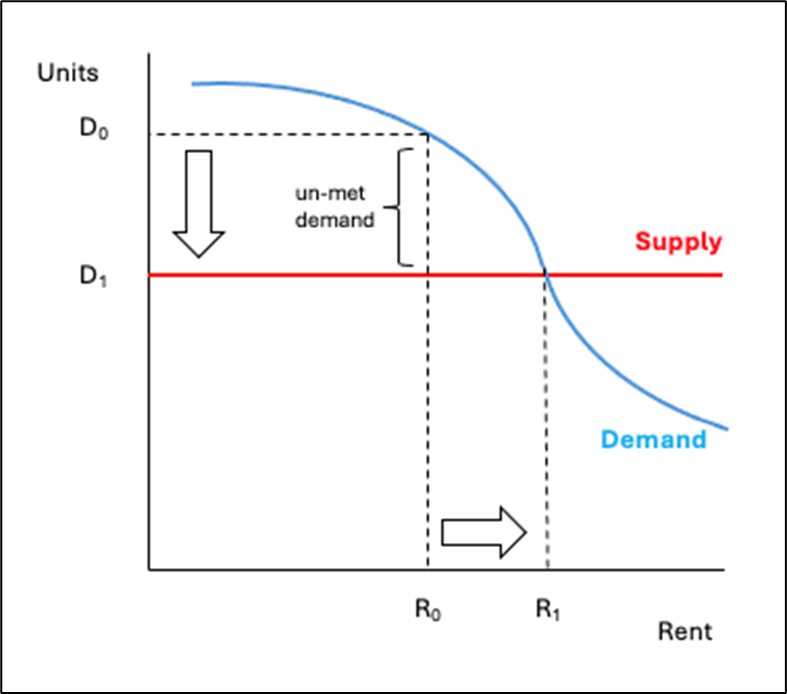
Because Supply was fixed in this case (the number of units in the building is finite, you
can’t produce more units when demand is high), there was minimal loss in Quantity
when the rent increased. The additional weekly rent went straight to the bottom line.
As the saying goes, “more risk, more reward”. For this BTR operator, the reward has far outweighed the risk.