
This article is the second in our series of Rentsetter personas. The previous article can be found here – The Overshooting Rent Setter
As with all case studies in this series, we have started with a real scenario and then modified the data to maintain data privacy. Nonetheless the key messages depicted by the data remain 100% valid.
Today’s article explores the Lazy Rentsetter. To understand Lazy, we should start off with best practice. And to understand best practice, I would like to introduce a chart.

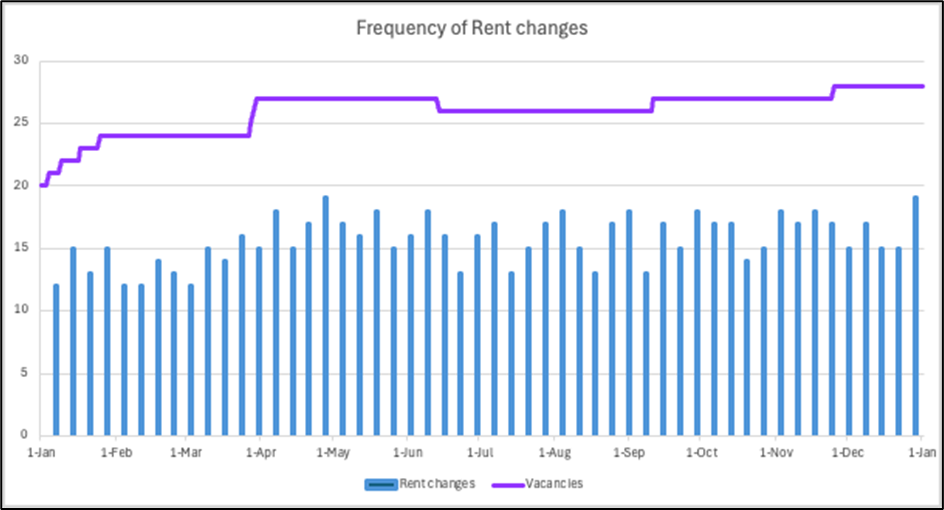
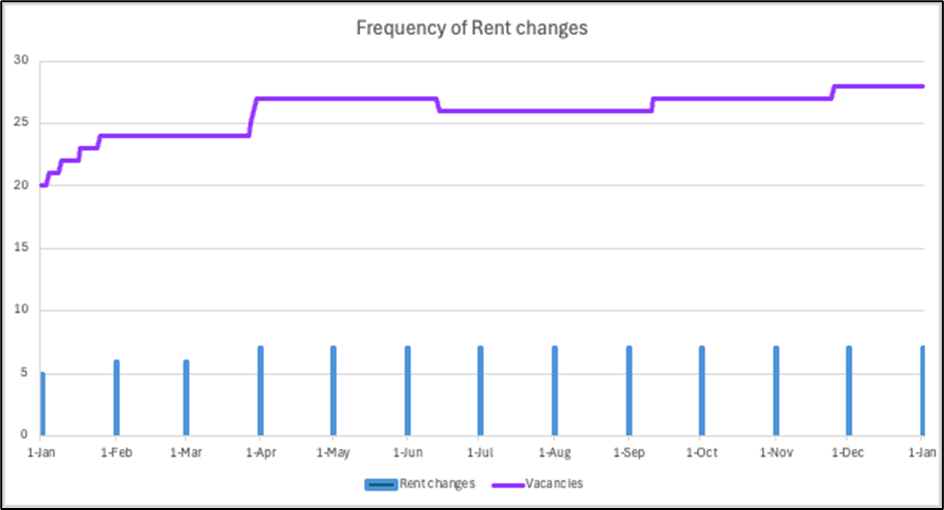
The Rent Change Frequency Chart
The charts below show the number of vacant apartments (purple line) and the number of rent changes (blue columns). The charts show us:
- The frequency of rent changes
- The proportion of vacant apartments subject to a rent change, each time rents are reviewed.
We introduced these charts because they clearly dispel a common myth within BTR operations teams. All too often, the head of the operations team will tell me that their team is very active in keeping rents up-to-date. These charts give me the ability to demonstrate that the team might not be quite as active as the head of operations was led to believe.
If you are the head of operations, I would encourage you to produce these charts each month. And if you are responsible for pricing, I would encourage you to start updating your rents more regularly (or ask Price Wizard to do so) before your head of operations starts preparing these charts.
A quick story: There was one case where the CEO of a BTR business proudly told me that his team were updating rents every week. It turns out they had only updated their rents twice in the previous year!

Industry Best Practice
Chart 1 resembles the pricing of most of Price Wizard’s clients. We update rents for most vacant rooms every month.
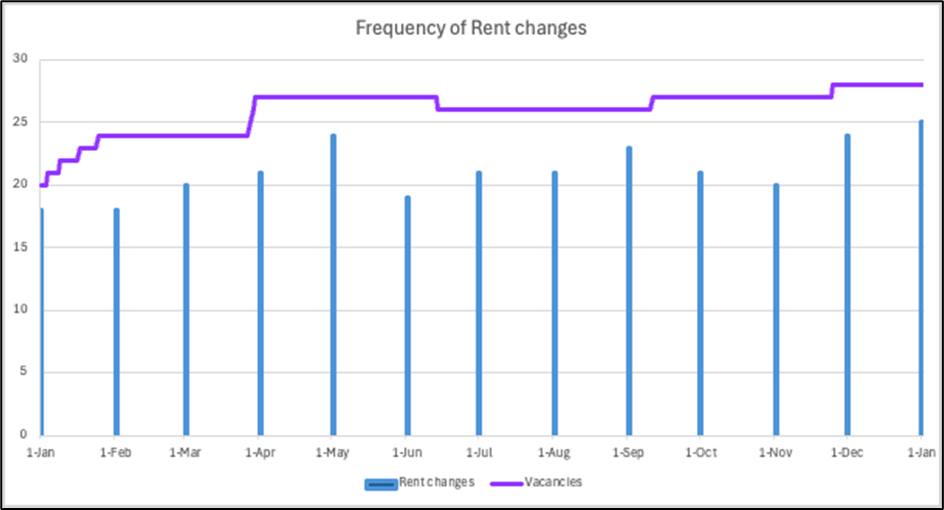

Chart 2 also reflect a valid approach. In this case, rents have been updated weekly.

I can even live with chart 3, which has a smaller proportion of vacant apartments being re-priced each week.
If your chart resembles any of the 3 charts above, congratulations. You are actively managing your pricing.

Not such good practice
Sadly, not all BTR operators are so active. Here is an example we saw recently:
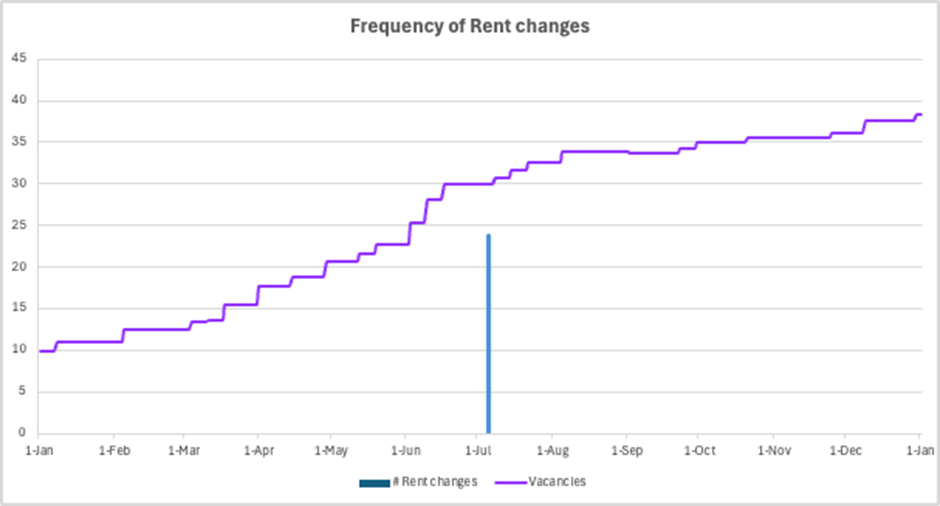

As shown in Chart 4, the site started the year with only 10 vacancies. The number of vacancies slowly crept up during the year. In the middle of the year, the operations team reduced rents which slowed the speed of the lease terminations, and even attracted some new tenants. However, the rent reduction wasn’t sufficient, so the number of vacancies continued to grow, albeit at a slower pace.
It is interesting to observe what was happening to asking rents in the local market, and at the site in question over the same period.
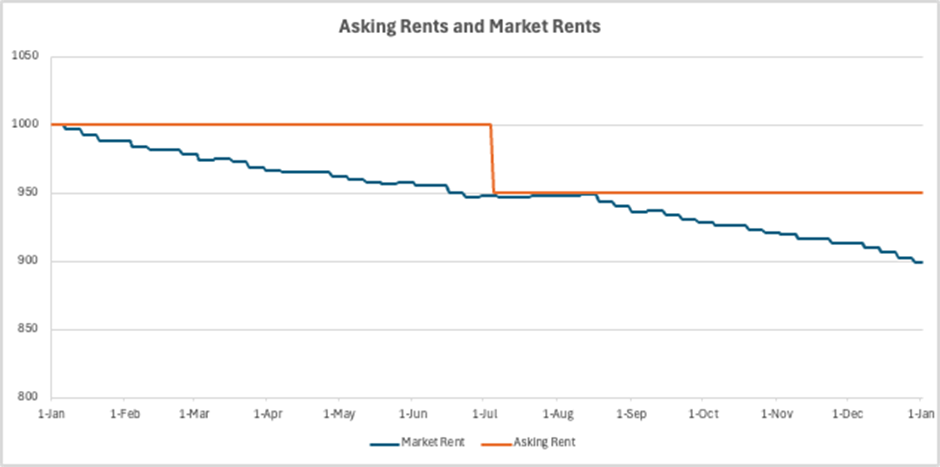

Combining Charts 4 and 5, we can see there were 3 phases throughout the year:
| Phase | Asking and Market Rents | Vacancies |
| January – March | Market Rents and Asking Rents started in alignment. Market rents slowly fell, resulting in Asking Rents starting to become expensive. | As Market rents started to decrease, vacancies started to increase |
| April – June | Market rents continued to decline. Asking rents became expensive relative to the market. | Vacancy numbers accelerated |
| July – December | Asking rents were reduced | Vacancies stabilised for a brief period, and then increased again once market rents continued to fall. |

Conclusion
This case study shows what happens when BTR operators don’t manage their asking rents actively. Changes in market dynamics (or indeed, changes in any other driver of occupancy) can quickly flow through to business results.
Good BTR operators are constantly tweaking their rents. Better operators recognise that setting rents is a sophisticated task which is best left to specialists. And then there are lazy operators. Which one are you?