Let’s revisit high-school economics. Don’t worry, we will keep it simple.
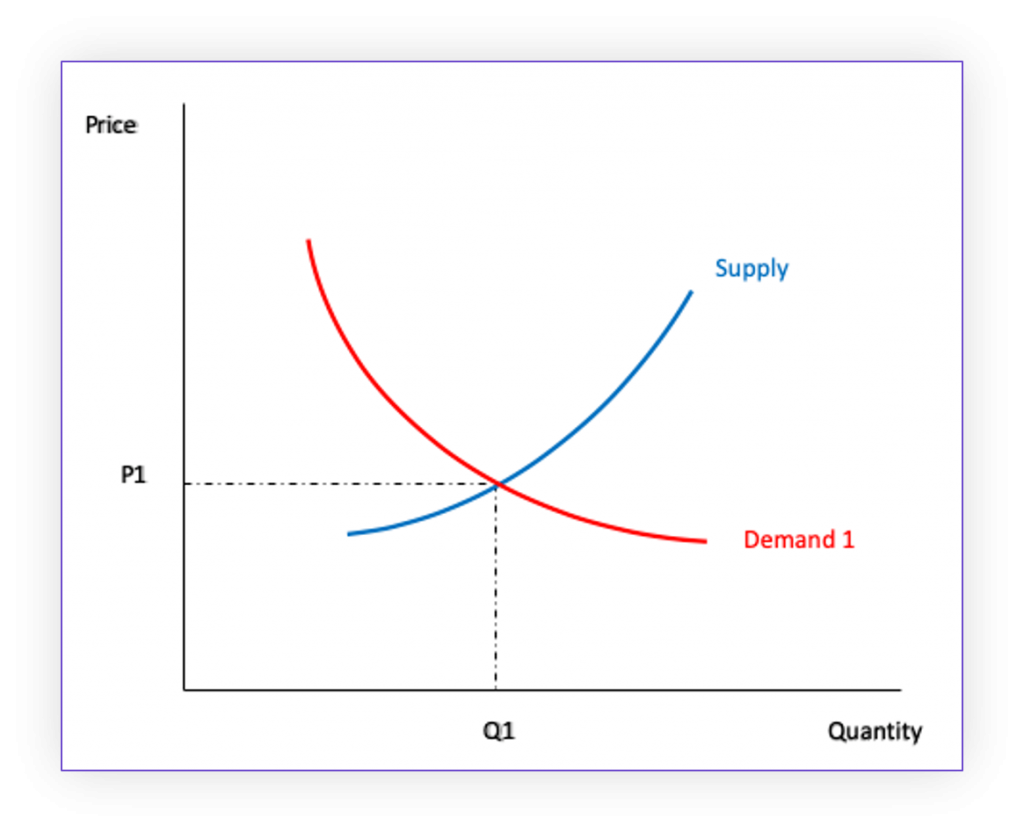
We’ll start with a basic supply and demand curve in Chart 1. The demand curve slopes down to the right. That means that as price increases, customers want to buy less. In contrast, the supply curve (S) slopes up and to the right. As price increases, suppliers want to sell more. The point at which demand equal supply is the optimal price to charge. Any lower price will result in being unable to meet demand. Any higher price will result in excess unsold stock.
Chart1: Standard supply and demand curves
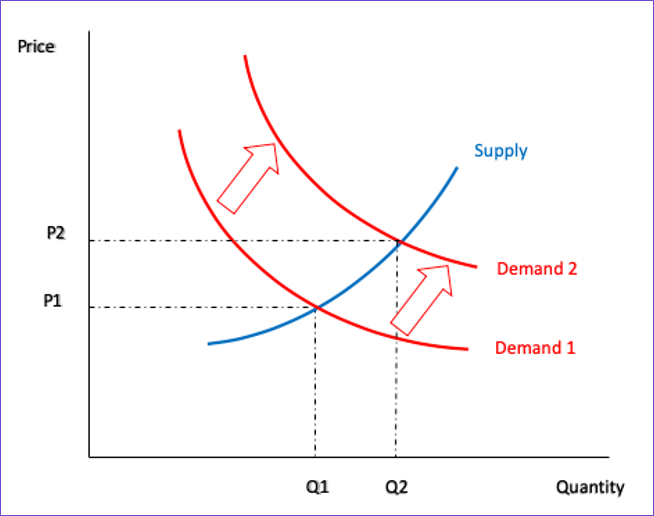
Next we look at what happens if demand spikes and the demand curve moves up. As a result the optimal price increases from P1 to P2. If we didn’t increase our price then we would sell out of our stock early. This is why it is important to always be updating prices.
Chart 2: An increase in demand
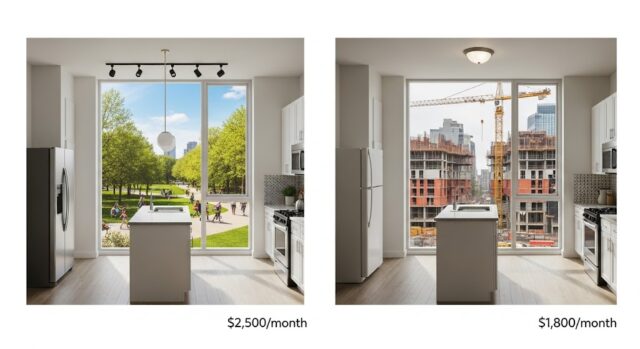
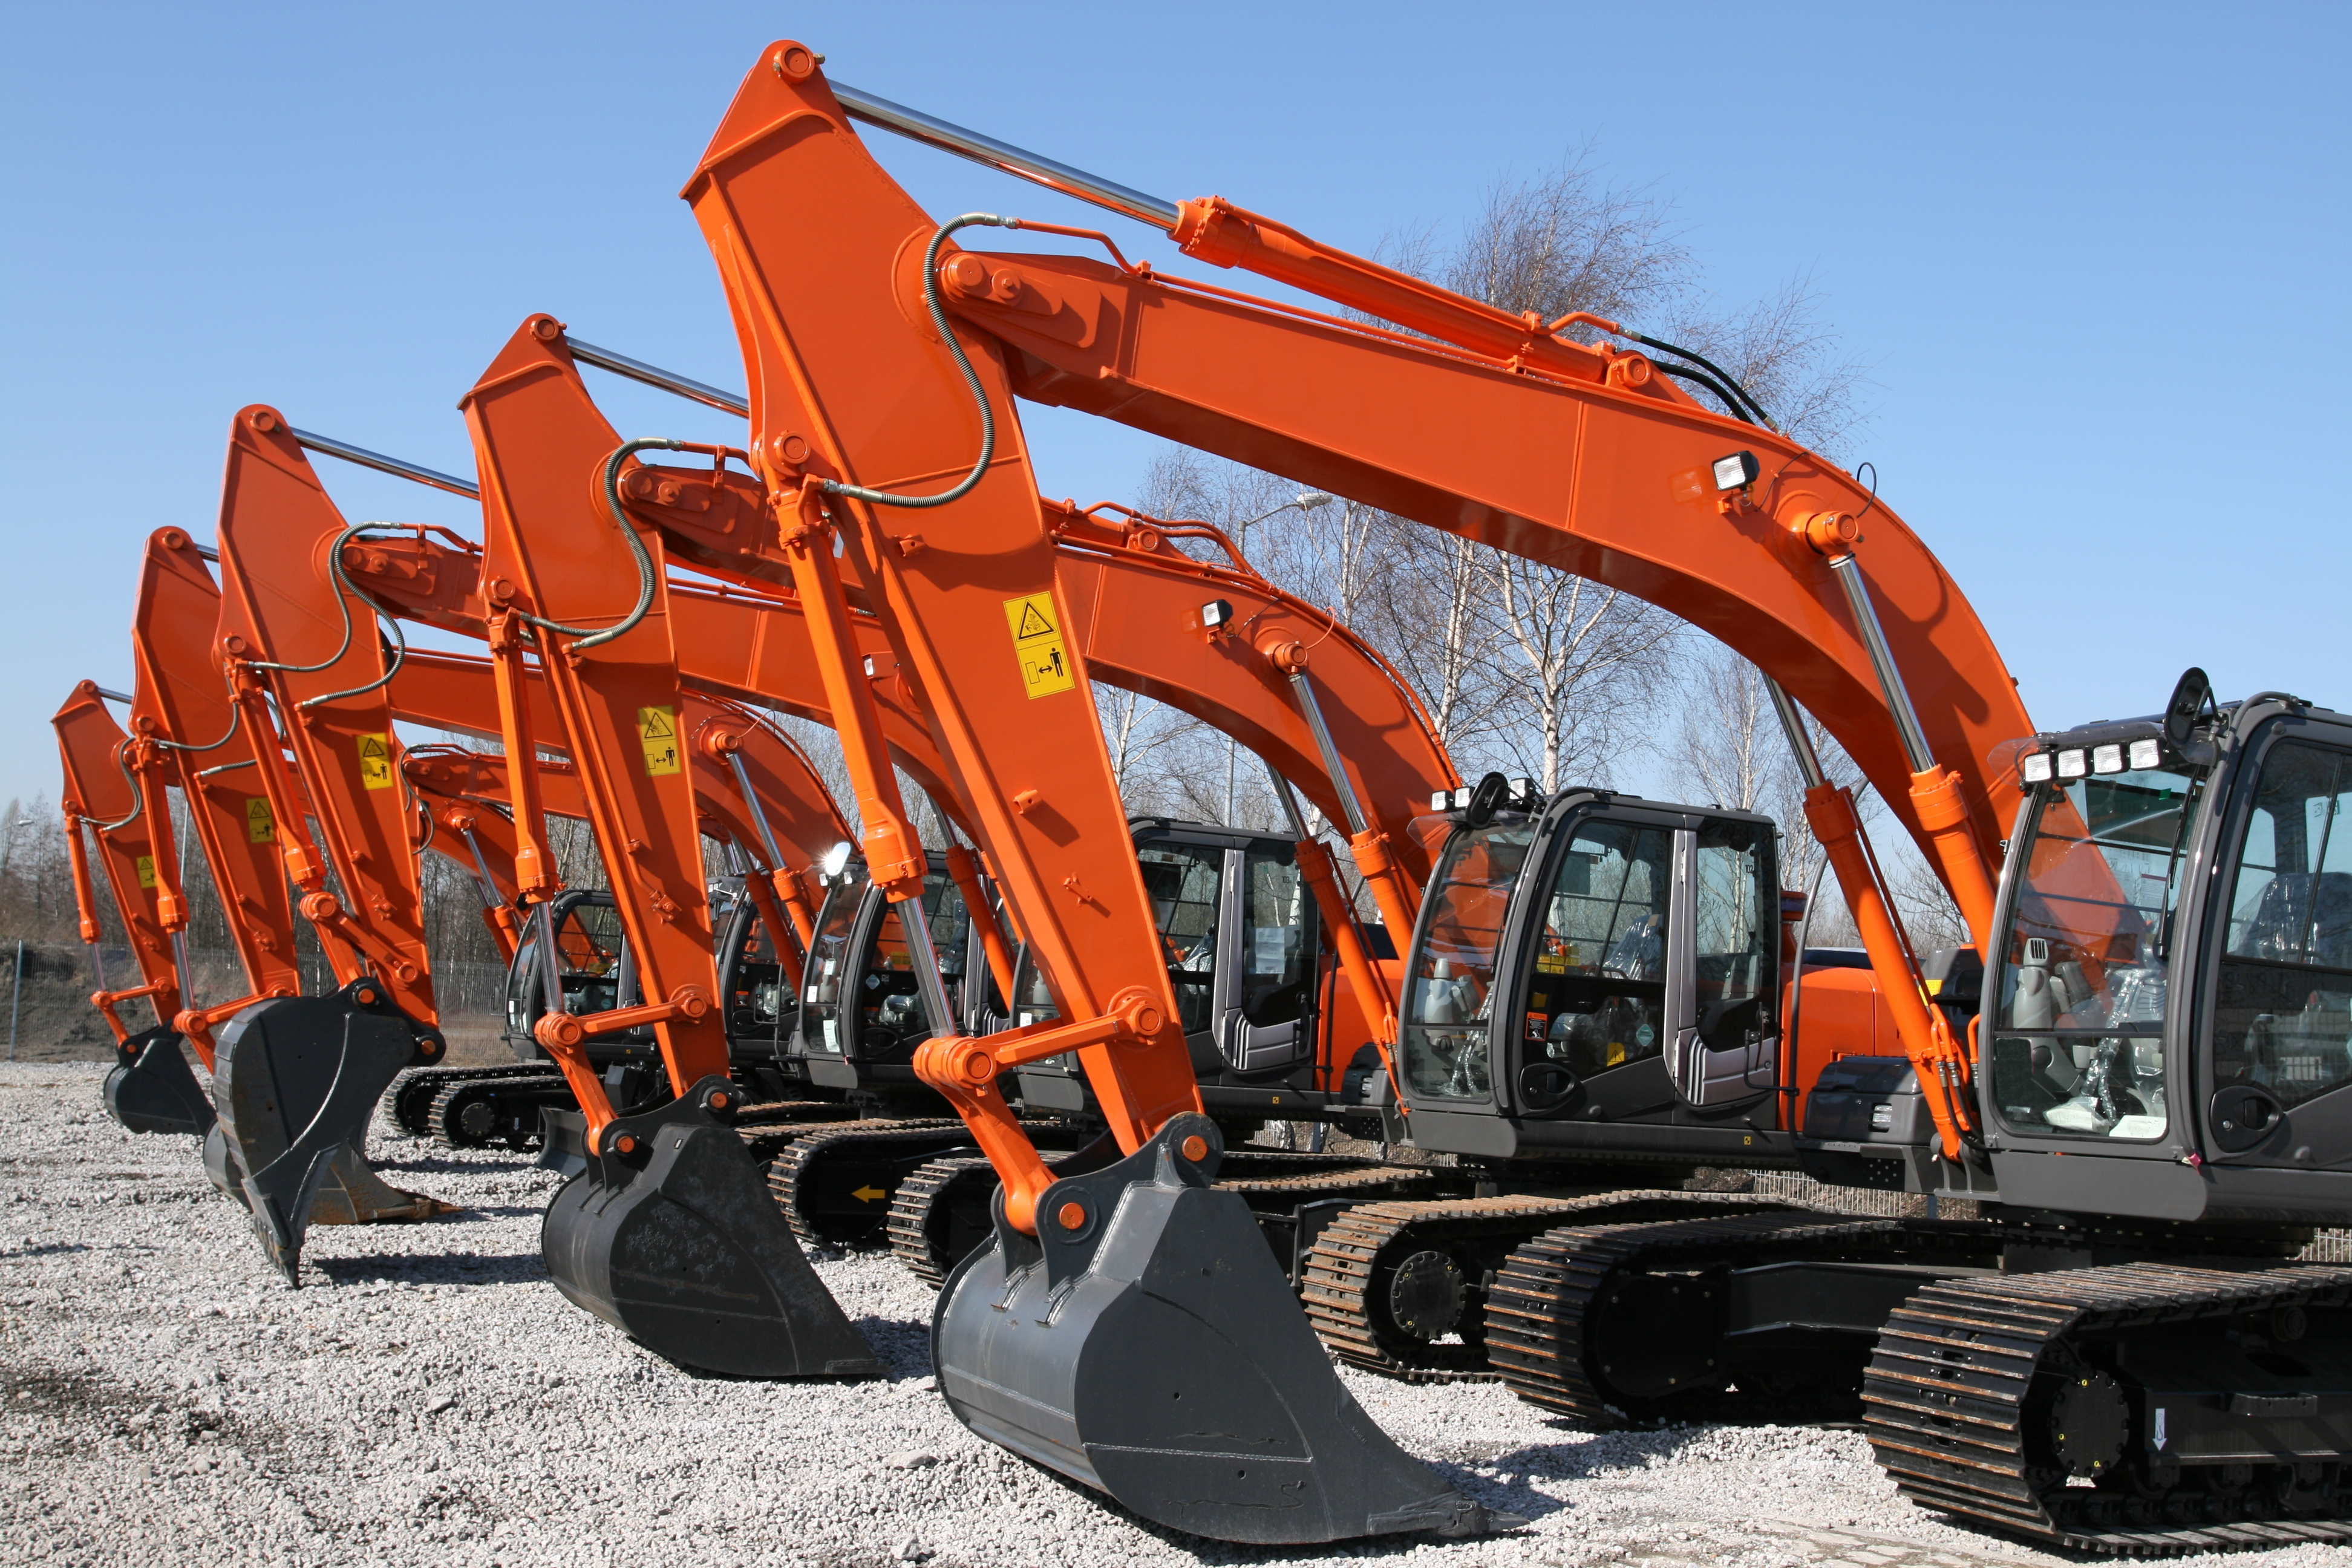
However, note that in the example above it assumes the business can also increase production to meet the higher demand. This scenario above is not representative of many businesses who have fixed supply. For example – if you are selling books and you can see demand increasing, you would print more books. That is, supply can be varied. However if you are selling flights or hotel rooms or rental equipment or tickets then you can’t suddenly build more capacity just for the busy period. The supply curve is vertical because the quantity is completely fixed. It looks more like this:
Chart 3 – vertical supply curve
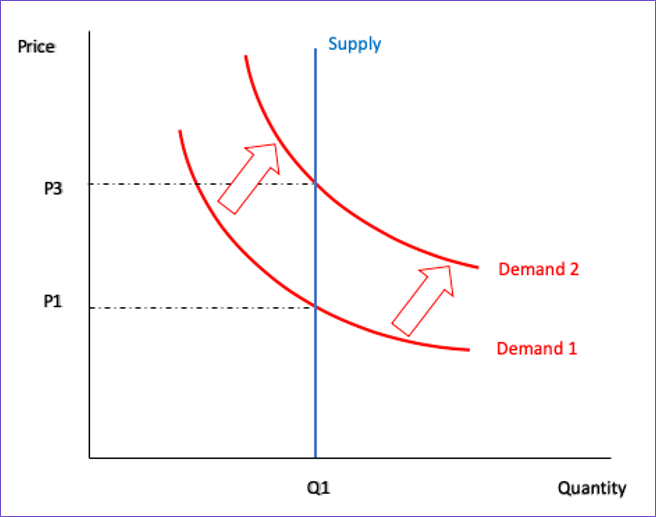
Once again, you should be increasing your price. However this time the price increase should be even greater than in the Chart 2.
This demonstrates that for businesses with limited supply, it is even more critical to be constantly adjusting your prices in line with supply and demand. This is where Dynamic Pricing is most useful.