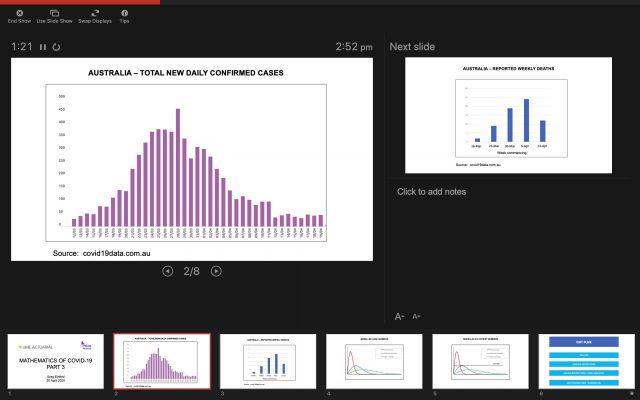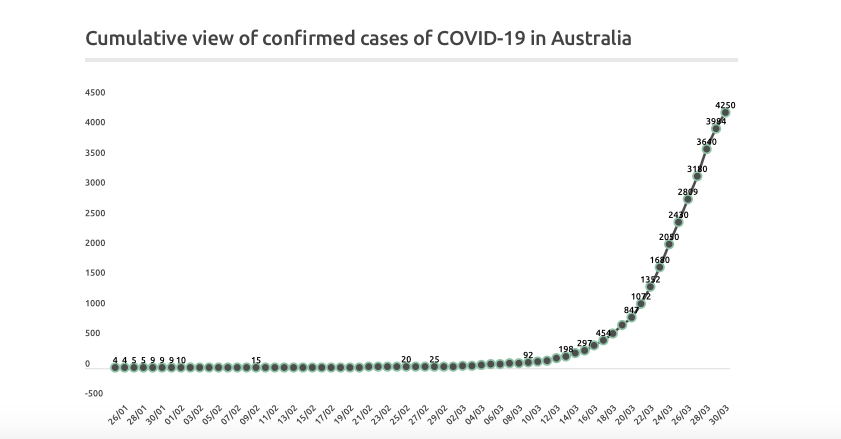
There appears to be a bit of confusion in the community as to the COVID-19 growth rates and what the different charts mean. In this video I explain the key charts.
While this isn’t directly related to Dynamic Pricing or revenue management, we have included this in our blog due to its connection to data and the anxiety in the community at present.